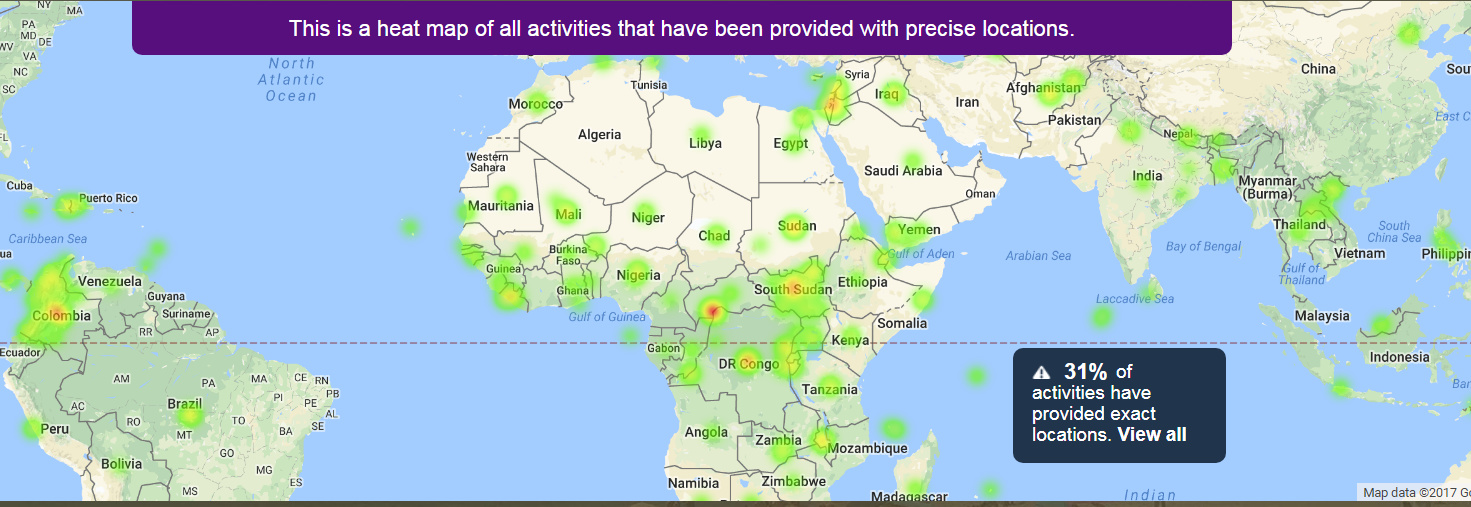
A discussion took place on twitter in the wee hours of Friday night. It started with a d-portal map of UNDP activities


Jonathan van Geuns commented:

Hmm… “This is a heat map of all activities that have been provided with precise locations.”

And so it started:

RE Sieber

Just realized that most of these are likely “heat maps” of a country’s centroid #FakeHeatMaps

Bill Anderson

Numbers in the centre of a country refer to national programmes. Others will have more refined coordinates

James Coe

If truly national, surely a country code is suffice? A geocode only makes sense for a precise location (as stated). If implemented in one place but helps people nationally then geocode capital and use geographic location reach element?

Bill Anderson

Don’t you want to see all activities on a map?

James Coe

Yes, but properly coded. If activity is in 1 place but impacts nationally, use geographic reach element. Central geocodes add nothing.

RE Sieber

A map is a meaningful communication medium only if the spatial distributions are meaningful. Bunch of centroids w fake hotspots? Not so much.

Joshua Powell

I believe the location standard is explicitly subnational, no?
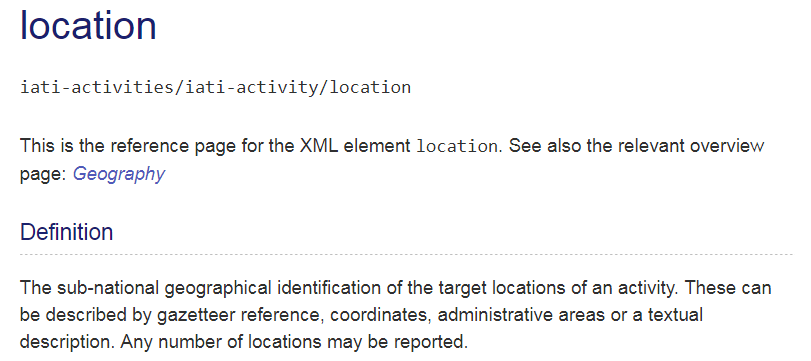


Bill Anderson

Who wrote that? (Watch out for 2.04 proposals)

So how would you represent an activity of national scope alongside others with specific locations?

RE Sieber

Cartographically, you can’t do both on the same map. Either show choropleth or pointilize all: call national scope a capitol (bldg) activity

James Coe

Could colour code difference between an activity w/ “actual location” and activity w/ “impact location”? TA projects being the former.

RE Sieber

It’s a feature dimension problem: points r 0D. If you really want 2D areas then you need to demand more x,ys. Long-standing prob w #IATI

Andy Lulham

  • This is presentational, though. d-portal could choose to do it this way (or other ways) by deriving co-ords from recipient country(s).
  • But adding spurious co-ords to data for presentational reasons seems objectively incorrect.
  • Forces hand of presentational tools, & dilutes other data bc no way to tell which are accurate.

Bill Anderson

Do you honestly think that is a realistic, pragmatic solution?

RE Sieber

Realistic if IATI folks got together w GIS techs, who have lots of country & subnational boundary files. Maybe more users if data qual improved

Ana Brandusescu

I understand that impacts aren’t exact. But the all-areas-can-be-represented-by-centroids-and-we-can-lump-them-together isn’t working.

Bill Anderson

Perhaps standardising around administrative areas is a better option. But they do tend to change substantially over time …

RE Sieber

If that’s a problem, 1 option is to provide a GUI in schema for location: draw impact area on map. Another is bounding box

Comments (12)

Bill Anderson
Bill Anderson

My 2p

  • Different users need different levels of accuracy from geo-referenced data.
  • There is a strong argument for providing information on all activities on a map. It may not be geospatially pure, but it tells a useful story. Data doesn’t have to be perfect to be useful.
  • If activities of national scope are not assigned coordinates the onus is placed on the user to construct the information on all activities from two sources (coordinates or country codes). The whole thrust of IATI data use strategy is to make things easier for the user.
  • I’m not bothered whether these coordinates are for the capital city or the country’s centroid.
Andy Lulham
Andy Lulham
Image removed. bill_anderson:

If activities of national scope are not assigned coordinates the onus is placed on the user to construct the information on all activities from two sources (coordinates or country codes). The whole thrust of IATI data use strategy is to make things easier for the user.

The onus isn’t placed on the user to do this – it’s on the presentational tools (e.g. d-portal; perspective). The end user should not be forced to deal directly with XML, or with co-ordinates, or derive co-ordinates from recipient countries. The tools should be in place to handle that.

Yohanna  Loucheur
Yohanna Loucheur

The point of using a gazeteer is that it allows publishers to map their activities accurately AND visualization tools to show the activities as they want. A project with national impact should be coded at national level; providing coordinates is meaningless. If someone decides to show this project on the capital or centroid, they can retrieve this info from the gazeteer and the onus is on this user to indicate in the representation that this project is national (and not only benefiting the capital).

It’s really important to convey the scope of a project’s impact. Simply assigning projects to an arbitrary point (eg the capital city) is very misleading or, worse, can confirm misconceptions that donors are favouring/neglecting some regions, which can have serious political consequences.

So when are we having this miniTAG on geocoding? Those are exactly the kind of issues I think we need to discuss: how to geo-code and how to represent projects on maps in meaningful ways.

James Coe
James Coe

I agree with the vast majority, but throughout our consultations, Open Ag heard the case for publishing the physical location of the activity and the area of impact. As I understand it, publishers can distinguish between the two using the Standard.I dug into the issue a little more on this blog I wrote a short while ago. I also agree that there’s no benefit to publishing centroids.

That said, there’s a lot of nuances and different perspectives around location data so I’m 100% behind some sort of ‘mini-tag’ / event on it. I actually think we could fill a full day digging into the different issues, and would probably want a solid way of VC’ing people in. Tagging Reid Porter .

Vincent van 't Westende
Image removed. YohannaLoucheur:

Simply assigning projects to an arbitrary point (eg the capital city) is very misleading or, worse, can confirm misconceptions that donors are favouring/neglecting some regions

It also makes it harder to find out which activities actually do take place in those capital cities.

I would say we actually lose accuracy instead of gaining it through those “precise locations”. It is derivable data and a presentation layer issue that imo does not help to make it easier when added to the data layer.

To add to the related discussion on how to visualize:

RE sieber:

Cartographically, you can’t do both on the same map. Either show choropleth or pointilize all: call national scope a capitol (bldg) activity

Agree. If the goal is to show all IATI activities on a map you would also miss out on all (supranational) regional activities. Regions, countries and exact locations just visualize differently and imo making them all act like exact locations in a heatmap will be quite subjective. Wouldn’t it be more useful for the user to visualize this in three switchable layers on a map?

  • 45% of activities have provided a recipient region -> visualize as desired ; )
  • 60% of activities have provided a recipient country -> choropleth layer, could have an optional switch to just show the ones without a exact location if thats desired
  • 33% of activities have provided exact locations -> heatmap layer.
Vincent van 't Westende

I’ve been hacking around with exact locations a bit yesterday to see if the approximate locations were re-used a lot (since you can’t exactly see that from a heatmap). Not sure how useful this visualisation is but I’ll just share it here in case it helps anyone to bring new insights.

http://bit.ly/2g9uBu0 (full speed fan warning, its quite heavy to load and might take some time, 130k IATI location coordinates). The more occurrences within one of those hexagons, the higher the hexagon will be.

You could add national scope activities without exact locations in a centroid hexagon, per country, in a different color, and a different height scale, if you would want to show it all in one map.

David Megginson
David Megginson

Assuming we’re marking national-scope activities (e.g. general education-ministry budget support; national women’s health helpline), the mapmakers can distinguish then with different iconography—for example, the number of national activities could appear at the country’s geographical centroid in a rectangle (instead of circle), larger font, and different background colour.

We could also consider what to do when the user is zoomed in very close (eg move the national number off to the side).

D

Taryn Davis
Taryn Davis

Just wanted to share how we’ve done this for our AMPs (example here) we allow the user to select which level they are looking at, so it’s clear that you are looking at those coded to country level, or whichever admin level you select. Sure they are points which make them clearly clickable for the additional visual features, but you could just as easily highlight the whole country or regions. The important part is that you’re making it clear what level the user is looking at.

We would be happy to participate in a geocoding MiniTAG!

Vincent van 't Westende

Taryn Davis That separation indeed makes it very clear, I’d much prefer that to trying to show all levels in one view. Also, that app is very feature rich!

I did give it a try though to merge a national and exact location layer. David Megginson based upon your suggestions, here’s 2 approaches.

http://iatibugtracker.org/locs/1/ centroid boxes.
http://iatibugtracker.org/locs/2/ color differences on country borders… it causes some conflicts on color display at overlapping borders which could be solved by drawing the borders with an inset instead of on the border itself.

Conclusion on my side; theoretically we could probably get there, but could it be as useful (or complementary) as the approach Taryn showed… probably not.

Reid Porter
Reid Porter

Yohanna Loucheur and Taryn Davis pick a week for a DC miniTAG and either DevGateway or InterAction can host! What about November 15? Who else should we invite to present?

Yohanna  Loucheur
Yohanna Loucheur

I’d say a cautious yes (pending travel approval) to mid-late week of November 15. Also hope to bring a colleague with far more technical knowledge than mine!


Please log in or sign up to comment.